As a preparation for the design and implementation of a multi-echelon supply chain model, a simpler model was chosen. The Simple Model is an enterprise model with low structural complexity developed at Hewlett-Packard Laboratories. The model in described by M. Shahid Mujtaba [18]. Mujtaba's purpose when creating the model was to explore the relationship between different factors and metrics used in manufacturing. This was to be achieved through simulation. When gathering data from the simulation, Mujtaba [18] focused on metrics related to inventory levels and write-off at the end of the product life cycle (EOL write-off), as well as customer satisfaction. Mujtaba [18] describes the model and results of the simulations.
The objectives when implementing the Simple Model using COOL were several:
This chapter describes the model, and its COOL design and implementation. The model described here is as good as identical to the one described by Mujtaba [18], and the name, the Simple Model, is therefore kept. It is only in the implementation that the models differ.
The Simple Model as it is implemented here is a model of a small manufacturer of lamps. The manufacturer assembles the lamps from nine parts of three classes: three A parts, three B parts, and three C parts. There is one unit of each part in a lamp. The three parts of each class are indexed with 1, 2, and 3. Table  a) shows the value of each part. As shown in Table b) the value of the A, B, and C parts are 50, 30, and 20 percent of the product value respectively.
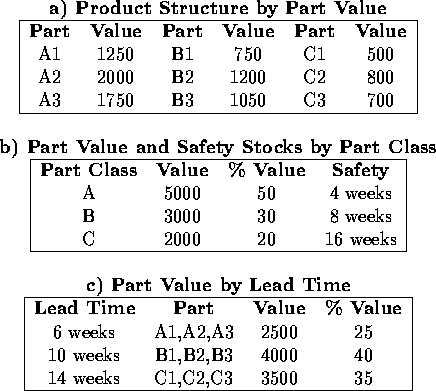
Table: Parts, Values, Safety Stocks and Lead Times in the Simple Model.
As shown in Figure , there are three inventories in the model: The raw product inventory (RPI), the work in process (WIP), and the finished goods inventory (FGI). The RPI is the inventory for incoming parts ready to enter assembly, the WIP are the products that are in the assembly, and in the FGI we find the finished products ready for shipment to customers.
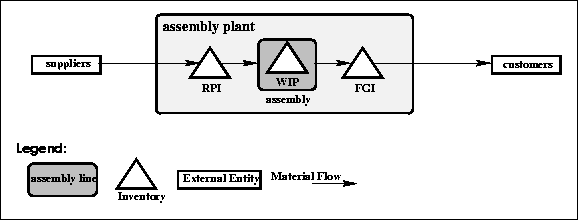
Figure: The entities and material flow in the Simple Model
A safety stock is the stocking level desired at any time for a given part in a given inventory. Holding inventory is costly , and the ideal situation would therefore be to have no parts in stock when they are not immediately needed. In the real world however materials and production planners meet many uncertainties. A safety stock superior to zero is therefore in general required for the RPI and FGI.
Although there are no uncertainties in this model, the principle of safety stocks is addressed. In the Simple Model safety stocks are calculated as a set number of weeks of the average forecasted demand for the 13 next weeks (including this week). We call this weeks of safety. For example if the average forecasted demand for part A.1 the next 13 weeks is 40, and the weeks of safety is 4, the safety stock level is set to 160. Table shows the weeks of safety for the different part classes. A parts have 4 weeks, B parts 8, and C parts have 16 weeks of safety. For the FGI we use 2 weeks of safety.
Time is measured in weeks. When a month is used this signifies four weeks.
When arriving from the suppliers the parts enter the RPI (see Fig. ). From the RPI the parts enter assembly (WIP), and are now referred to as products. A set of one unit of each of the nine parts makes up one product.
The parts have different lead times from suppliers according to the index. These are shown in Table c). Parts of index 1 have 6 weeks lead time, index 2 parts have 10 weeks, and index 3 parts 14 weeks. All parts are delivered according to lead time, and there are no damaged parts.
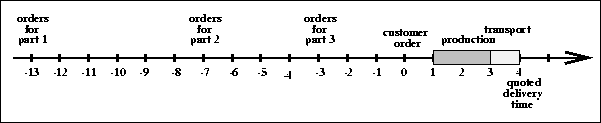
Figure: Timeline of materials flow.
Figure shows a timeline for the material flow in the Simple Model. Week 0 on the line is set to the week when a customer order arrives. To build a customer order, parts of index 1 (14 weeks lead time) most be ordered 13 weeks prior to the arrival of the order. This is indicated at week -13 of Fig. . Index 2 parts must be orders at week -7, and index 3 parts at week -3.
Parts can enter assembly instantaneously when they arrive in the RPI. The figure shows an assembly time of two weeks. Once out of assembly, the products enter the FGI, from where they are shipped to customers. Products are ready for shipment the moment they enter the FGI. Transport time to customer is one week. The plant quotes an order to delivery time of 4 weeks.
This section deals with the processes necessary to receive materials, assemble these to form products, and ship the products to customers.
.
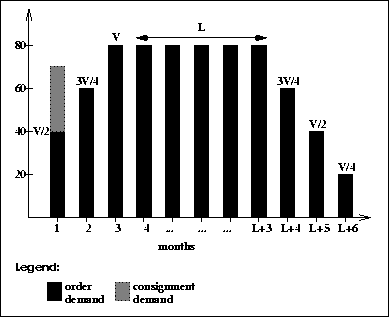
Top demand, V, is set to 80 units per week. The demand starts at half the top demand for the first month. The first month there will also be a demand for 30 units per week for consignment. These are products used for demonstrations and public relations purposes. The second month the demand increases to 3/4 of the top demand, and the third month we reach the top. The demand remains stable for the next L months. The initial value of L is 6. In month L+3 the demand decreases to 3/4 of V. The next month to half of V, and in the final month the demand is a fourth of V. The life cycle for the product is L+6 months, initially 12.
Materials arriving this week are delivered as orders are sent.
The functions of the company of the Simple Model and their responsibilities are already identified by Mujtaba [18]. These are: marketing, order processing, planning, shipping, production, R&D, vendors, and customers. When identifying agents, these functions were used. Basically one agent was made for each function. This supports the statements in Section (on motivation) regarding the ease of conceptualizing when using a multi-agent approach. Some alterations were made: a materials agent was added, shipping was renamed to dispatching and vendors were gathered in one suppliers agent.
This results in a COOL setup of nine active agents (as is seen in Figure ): Marketing, Order-processing, Planning, Materials, Production, Dispatching, Purchasing, Customers, and Statistics. (The role of the suppliers and R&D is not implemented.) The following describes the agents and their roles.
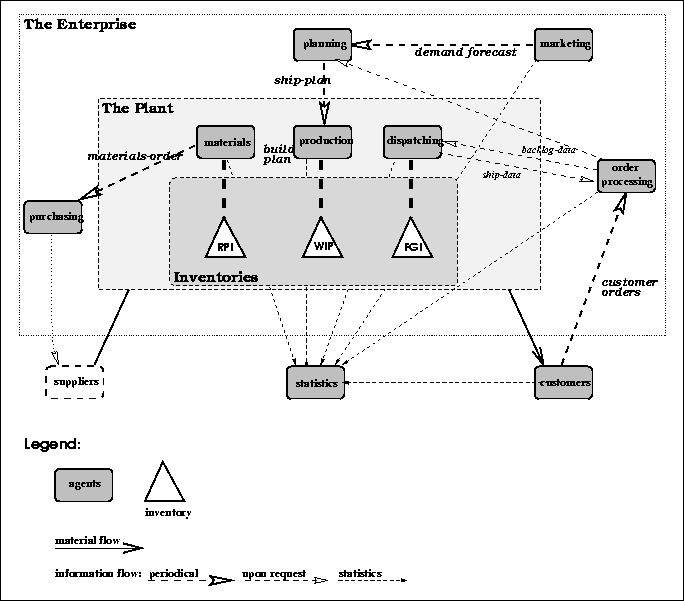
Figure: The agents in the Simple Model.
), and issues the demand forecast. The demand forecast is sent to Planning.
) below.
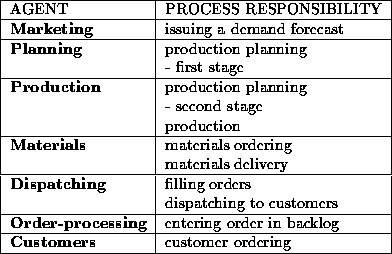
Table: The agents' process responsibilities.
Table shows the responsibilities of each agent. For most Simple Model agents, responsibility is limited to one or two processes. In the implementation of the model each agent uses roughly one main conversation class. This main class handles the communication and actions necessary to satisfy the agent's main responsibility.
Marketing, for example, uses the marketing-forecast-conversation class. The rules of this conversation class specifies the actions needed to make a demand forecast for the current week, and send the forecast to Planning. Upon receiving the demand forecast from Marketing, Planning initiates a planning-conversation. The planning-conversation class defines the actions needed to calculate and send the safety stocks and ship plan.
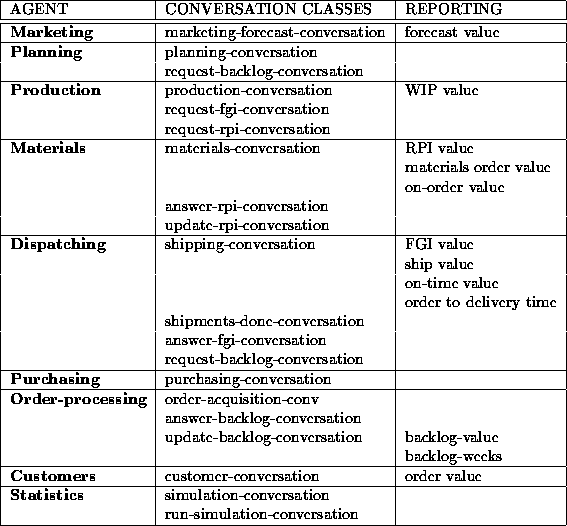
Table: Conversation class associations in the COOL implementation of the Simple Model
Table shows the conversation class associations. We see that Planning also uses a generic conversation class, request-backlog-conversation, which specifies the actions when requesting backlog data from Order-processing. The conversation class is called generic because it is used by several agents. The table also shows the reporting related to each conversation class, i.e. the statistical data that is sent to Statistics. This is further treated below.
Note that when an agent uses a class like the request-backlog-conversation, the agent receiving the request needs to use a conversation class specifying its actions upon the receipt. For the request-backlog-conversation, Order-processing uses the answer-backlog-conversation. This is a generic property of COOL: When a message is sent the receiver should have a corresponding conversation class that defines some sort of response to the message.
The simulation is run with discrete time intervals. The granularity is one week. A simulation starts with an initial 20 weeks before any customer orders arrive, i.e. the first customer orders arrive in week 21. The simulations start with all inventories empty, and no materials ordered.
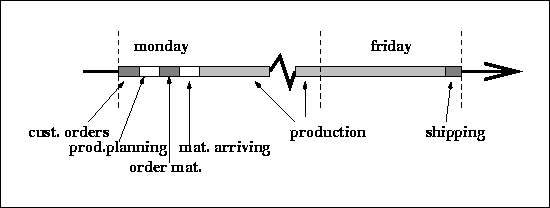
Figure: The sequence of processes within a week.
The Statistics agent is responsible for the weekly progress of the simulation. Through the running of a week it is the sequence of processes that keeps track of time. This is shown in Figure . The week starts with customer orders coming in. Next the production planning (demand forecast, ship plan, and build plan) takes place, ending in the ordering of materials. Before production starts, the materials due this week arrive. Production runs till Friday afternoon, when due orders are shipped. The sequence of processes is assured by coordinating the conversations as will be shown below.
As seen from Table Statistics uses two conversation classes, the simulation-conversation and the run-simulation-conversation. When starting a simulation a simulation-conversation is initiated. This conversation will remain active through the whole simulation. At the beginning of each week a run-simulation-conversation is initiated. A message is sent to Marketing telling it to issue a demand forecast. The forecast is sent to Planning. Upon receiving the forecast Planning sends a ship plan to Production. Upon receiving the ship plan, Production sends a build plan to Materials, triggering it to send materials orders to Purchasing. In this manner the correct sequence of processes is assured during the materials and production planning.
When Materials have sent orders, it checks the on-order data base for incoming materials. When this is done, we are ready for production. Materials will give Production the current RPI-levels, and Production simulates the movement of products from the RPI, through the WIP, and into the FGI. Dispatching is notified on finished products, and Materials of raw product usage. At this point, the week's production is finished, and we could say it is Friday afternoon. Dispatching fills and ships orders.
We are now at the week's end. Through the running of each week, the agents have sent statistical data to Statistics. This is usually done at the end of the agent's main conversation class. Statistics knows that the week is ended when it has received all the week's statistical data from the agents. The run-simulation-conversation saves the statistics and terminates. The simulation-conversation advances the week counter, and initiates a new run-simulation-conversation.
Simulations were run with these parameters (initial values in italics):
, values of K: 0.5, 0.75, 1, 1.5, and 2), values of L:0, 1, 3, 6, and 12 months we see that it is currently 25, 40, 35 respectively), values of lt: (100, 0, 0), (25, 40, 35), (0, 100, 0), and (0, 0, 100)
Because an aim was to verify the COOL implementation by comparing the simulation results with those of Mujtaba [18], the same statistical data were recorded, with focus on inventory values and customer satisfaction. We may say that all performance data come from within an agent's domain, e.g. the RPI values is the domain of Materials and the backlog the domain of Order-processing. It is therefore this agent's responsibility to report RPI-value at the end of each week. Section (the motivation section) states that agents may be given the responsibility of recording data of their respective domains. This is followed through here.
Table shows from which agent statistical data is sent, and in which conversations this is done.
The results of the simulations are thoroughly described and discussed in Mujtaba [18]. Only examples of the results will be presented and commented on here. Note that the objective was not to analyze the performance of the Simple Model, but to verify the correctness of the implementation through comparing the results with those of Mujtaba [18]. Each of the subsections below deals with a series of simulations where the value of one of the parameters was varied.
Mujtaba [18] ran more experiments than these, but the simulation described below were judged sufficient to verify the correctness of the implementation.
A small application was implemented to display the data resulting from the simulations. The tool allows the user to browse all data which is save by the statistics agent (or simulation agent for the PMC Model). The application allows the user to draw predefined graphs. The graph figures presented in here and in Section are all generated in this way.
The graph figures are built up as follows: Each column of graph windows correspond one simulation. The upper row of the figure gives the name of these simulations. Figure , for example, presents data from five simulations, with names from left to right: AF=0.50, AF=0.75, AF=1.00, AF=.50, and AF=2.00. Which data is presented is labeled over the graphs themselves. The label gives a descriptive name to the graphs. Figure shows customer orders (actual demand) in black. The graphs may be draw in different colors in the same windows, as in Figure , or in separate graph window rows as in Figure .
The first series of simulation tested the effect of changing the ratio of actual orders to forecasted orders (A/F). Figure shows actual demand in black and forecasted demand in gray. Figure shows the effect of A/F on inventory levels in the RPI (gray) and FGI (black). As expected we experience stock-out in the FGI when demand is higher than forecasted. A less intuitive result is that of the RPI when A/F is 1. We see than even though our forecasts are correct, we still have an EOL write-off from the RPI of $108,000.
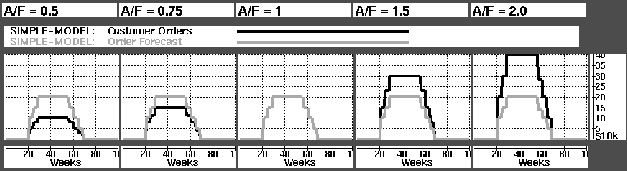
Figure: Graph showing Acual Orders and Order Forecast
Customer satisfaction was measured, among others, through counting the number of units delivered on-time (within quoted order to delivery time, here: 4 weeks). Figure shows how this quickly drops to zero (black line) as actual demand is increased. Figure shows that the reason is FGI stockout.
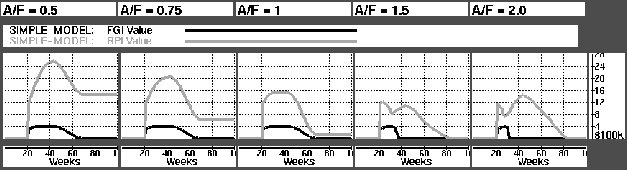
Figure: Graph showing the values of RPI and FGI inventories as A/F increases.
It is obvious that the model does not handle different A/F ratios very well. A too low A/F gives an enormous EOL write-off in the RPI (for A/F = 0.5: $1.4 million), and a too high A/F gives a low level of customer satisfaction.
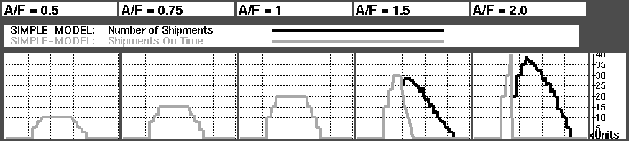
Figure: Graph showing how customer satisfaction decreases as A/F increases.
As long as the other parameters are kept constant, varying the value of K (coefficient to the weeks of safety) only affects the materials side (RPI, on-order). As customer orders do not arrive before week 21, the plant has enough time to order materials. The graphs in the bottom line in Fig. shows the value of each week's materials order. As long as there is no forecast of orders, there are no safety stocks. This means that the safety stocks are not filled until week 21. We see three destinct highs appearing on the graphs. These represent the orders for materials to be delivered in week 21. These are only for filling safety stocks. (Production for orders in week 21 starts in week 22, see Fig. ). As we increase the value of K, and therefore the level of safety stock, the peeks on the materials ordered also increase. This naturally gives a higher value of the orders in the on-order data base shown as the top line of Figure . The period of high value of on-order ends at week 21 when the materials are delivered, and the value of the matrials is thereby transferred to the RPI (middle line in Fig. ).
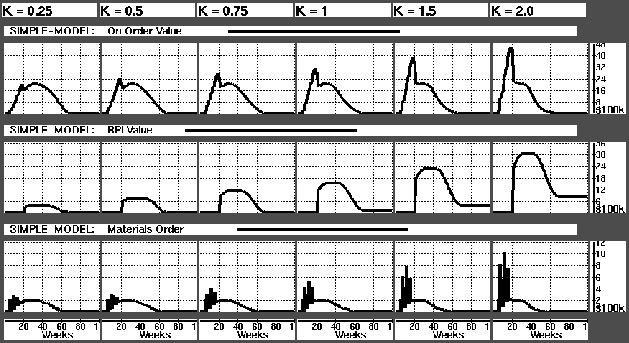
Figure: Graph showing the effect on materials orders and inventory as K increases.
It is obvious from the RPI value graphs that a too high value of K gives an unacceptable EOL write-off in the RPI . With a K of 2 materials worth more than $812,000 are left for scrap. Assuming this setting of the model, a K of about 0.75 is the highest we should go to avoid EOL write-off.
Next the simulations were run with different values of L (length of period with highest demand). From the Figure we see that as the L increases the committed inventory (sum of physical inventories and on-order) reaches a stable level at $4.4 million.
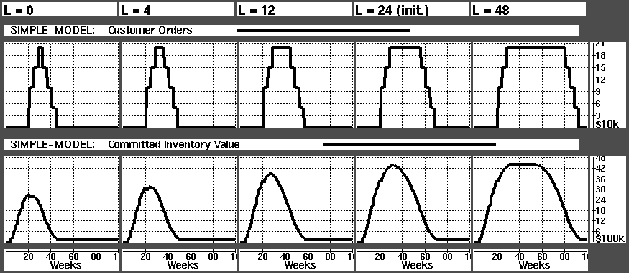
Figure: Comitted inventory as L increases. L is given in weeks.
Figures and are examples of results obtained when varying the quoted order to delivery time, Y. Fig. illustrates the order to shipment time. We see that the delay between the graphs is Y-1. With a transportation time of 1 week, this gives an order to delivery time of Y.
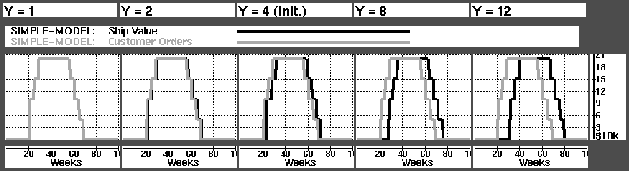
Figure: Visiualizing varying delivery times.
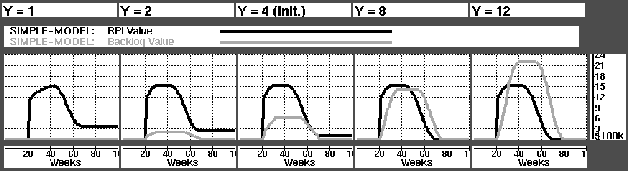
Figure: The backlog and RPI values with varying delivery times.
On the customer satisfaction side the model performed well. We see from Fig. (grey line) that the backlog values are stable on Y-1 times the weekly demand. This shows that orders are satisfied as planned. On the materials side, however, the black line of the figure shows that the EOL write-off increases as the value of Y decreases. According to Mujtaba [18] |em ``this is intuitively correct: the longer the quoted availability, the longer we can afford to wait before ordering material''.
The parameter lt gives percentage of value of the product from parts with 6, 10, and 14 weeks lead times respectively. The upper row of Figure shows the value of materials ordered each week. In the three last graphs in the row there is only one clear peak. The peak occurs in the week which material to fill safety stocks in week 21 is ordered. As we increase lead times (from right to left) the peak will of course move to an earlier week.
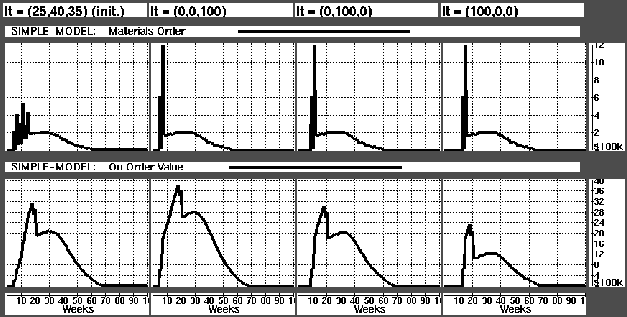
Figure: Materials ordering when lt varies.
With increasing lead times the on-order value (lower graph row) increases. This is intuitively correct, since orders will stay longer in the on-order data base.
A comparison of the results of the simulations with those of Mujtaba [18] showed that the implementation was correct.
Another objective of this part of the work was to be familiarized with the COOL language, and with running simulations using agents. As will be seen in the next chapter, many of the solutions developed for the implementation of the Simple Model are also used in the next model, unchanged or improved.
It was helpful to understand to a greater degree the dynamics of the supply chain before designing a larger model. By re-designing the processes and interactions among the entities (agents) in the supply chain, a greater understanding of their roles was obtained. This was particularly important for the production and materials planning. It was also useful to work with the terminology of the supply chain before taking on the larger modeling task.